Why and How to Start Implementing Predictive Analytics into Your Quality Systems
March 19, 2024
In an ever-changing industry with a dynamic regulatory landscape, maintaining high-quality standards is paramount. In the pursuit of delivering safe and effective products, the integration of predictive analytics into quality systems emerges as a game-changer, offering benefits that revolutionize quality processes and improve overall company performance. Let’s explore why companies should prioritize implementing predictive analytics into their quality systems and how to get started.
Why predictive analytics on quality systems?
In our experience supporting quality teams, we’ve seen a few patterns across the board that are hindering performance and causing frequent frustration, including:
- A lack of visibility into how systems are performing.
- A reactive culture and approach to quality.
- A misalignment of priorities across functions.
- A lack of management intervention during key events.
While we've identified these as some of the key drivers for implementing predictive analytics, other forces driving investments in advanced technology or “Quality 4.0” include regulator's increased adoption of data-driven approaches and heavier focus on risk with new regulations, rises in product complexity, and the competitive advantage of early adoption.
Leveraging predictive analytics can help organizations stay ahead of issues they are constantly dealing with and instead of fighting fires and being labeled as a “policing” function, prove to be a strategic and vital part of the value chain.
Imagine having data at your fingertips that lets you know when a lot is at risk for a timely disposition, which team member needs additional support or training, systems that are at risk, when management should intervene, and more.
It all sounds great in theory, but the question from many continues to be how we can make this a reality.
How do I get started?
Implementing predictive analytics may not be as complicated as you think. Many of the processes that are being performed daily are generating a ton of valuable information, but most practices lead to unstructured and scattered data. The key is transforming those processes to allow for the capture and collection of that data to then be able to apply predictive analytics and gain more meaningful insights. Let’s look at a case study on how a biotech company was able to assess the risk of a lot’s timely disposition by pulling together data from multiple quality and operational functions/steps.
Situation:
A global biotech company was ramping up production and release of sterile materials to various markets and was relying on CMOs to fill/finish and package the drug substance.
The company was constantly battling delays and surprises shortly before an anticipated disposition. This led to constant priority changes and rising frustration due to unsustainable workloads.
It was clear the company needed visibility into the risk to timely dispositions earlier to either address issues as they arise or change management expectations.
Solution:
OQSIE developed a tool that analyzed and visualized the risk for a timely disposition for a given lot. We were able to do this by identifying the different milestones across the long, multi-dimensional path of the value chain that have a large impact on the expected disposition date. For example, QC testing activities are largely independent of those of the CMO compliance activities, such as batch record review or the resolution of quality events.
These milestones are stacked on top of each other, and if one is not reached, there is a high likelihood of a following milestone not being reached on time either, unless appropriate management intervention is made. For example, if the Manufacturing Batch Record Review is not completed on time, QA Batch Record Review cannot start on time, increasing the risk that QA Batch Record Review will not be completed on time either.
Using this model, one can calculate a risk score for each milestone and aggregate over each dimension an overall risk score for that dimension. If one milestone is missed, the risk in its dimension will increase. If a subsequent milestone is met (e.g., due to increased management attention), the risk along that dimension will diminish again.
Related Content
About the Authors
Jaime Velez is the co-founder of Operations & Quality Systems Improvement Experts (OQSIE), a management and technical consulting company focused on supporting manufacturing, supply chain, and quality systems improvement initiatives at life sciences companies.
Thomas Thuene is an expert at the nexus of operational excellence, risk analysis, data analytics, and quality management. After several years in biotech and pharma research, he now works as a freelance consultant, primarily in the production and quality field.
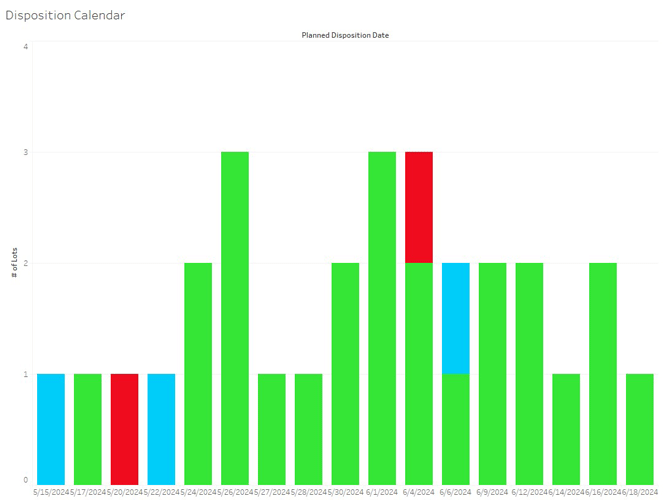
Figure 1: A fictious disposition pipeline. The graph shows the number of lots to be disposed of in the next several weeks, along with the overall risk to the lots meeting the planned disposition date. (All data shown is fictitious.)

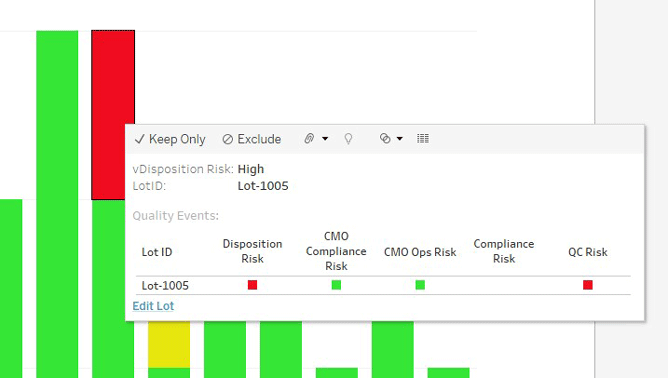
Figure 2: First level of drill-down for a specific lot shows the risk along the different dimensions.

The use of this tool allowed for several improvements. First, on an operational level, it provided better visibility of upcoming disposition risks for individual lots and pin-pointing managerial solutions. Second, earlier recognition that a certain lot would not be released as planned allowed for better use of resources and reduced context changes for them as well. At a high level, the tool allowed management to recognize where specific bottlenecks existed based on data.
Although Quality 4.0 may seem like a daunting task, there are ways to leverage the power of these technologies, like predictive analytics and Artificial Intelligence, without long and costly implementations. The key to gaining more powerful insights from your quality systems is transforming processes to remove practices that lead to unstructured data and partnering with experts who understand both the industry and the technology.

